
![]() Material Thermal Properties Database:
Material Thermal Properties Database:
This database is a small collection of thermal properties for materials used to construct common objects found in households and offices. Thermal properties which are relevant to fire behavior include the thermal conductivity (k), the mass density (ρ), the specific heat (Cp), and for materials that may undergo thermal degradation (i.e., pyrolysis) the heat of gasification (Lg) and the ignition temperature (Tig).
The database has been broken down into four categories according to material types: (1) Metals, (2) Plastics, (3) Woods and (4) Miscellaneous. For each entry, the thermal properties at room temperature and/or ignition temperature have been compiled from various sources. Some materials may have multiple entries due to variations in estimates of thermal properties from one source to another.
Variations across different sources illustrate the difficulty in determining accurate values for k, ρ, Cp, Lg and Tig. For complex materials, these properties are to be viewed as effective properties. In addition, these properties may change significantly with temperature.
Methods to Estimate Thermal Properties
Thermal properties at ignition temperature are determined through either a temperature correction to properties determined at room temperature or an analysis of cone calorimeter data. An example of the temperature correction approach is provided by Harper (1) ; in this Reference, thermal inertia at ignition temperature is calculated as the thermal inertia at room temperature times the room-to-ignition temperature ratio:
![]() (1)
(1)
An example of the cone-calorimeter-based approach is provided by Hopkins & Quintiere (2) and Spearpoint & Quintiere (3). Hopkins & Quintiere (2) perform an analysis of cone calorimeter data obtained for different values of the radiant panel heat flux to predict k, ρ, Cp, Lg and Tig of non-charring materials. Spearpoint & Quintiere (3) extend the method proposed by Hopkins & Quintiere to the case of charring materials.
Hopkins & Quintiere’s Method
Hopkins and Quintiere‘s method uses data from cone calorimeter tests combined with simple heat transfer theory to determine thermal properties of thermally-degrading solids. The starting point of the analysis is the one-dimensional heat conduction equation:
![]() (2)
(2)
where the thermal diffusivity, α, is assumed to be constant. Convective and radiative heat exchanges between the solid sample and the surrounding gas are assumed to occur at the surface of the material. Before the start of pyrolysis, one may write:
![]() (3)
(3)
where k – Thermal conductivity [W/m-K]
![]() - Net surface heat flux [W/m2]
- Net surface heat flux [W/m2]
ε – Emissivity [1.0]
![]() – External heat flux [W/m2]
– External heat flux [W/m2]
hc – Convective heat transfer coefficient [10 W/m2-K]
T – Solid temperature [K]
To – Ambient gas temperature [293 K]
σ – Stefan Boltzmann constant [5.67 x 10⁻⁸ W/m2-K4]
α – thermal diffusivity [m2/s]
The depth of the heated layer inside the material is known as the penetration depth δ. The penetration depth is determined to be approximately:
![]() (4)
(4)
Assuming that gasification occurs at the solid surface and at a fixed temperature, called the ignition temperature Tig, and also assuming that the solid sample is thermally-thick, the ignition time may be expressed as:
![]() (5)
(5)
where r – Mass density [kg/m3]
![]() – Specific heat [J/kg-K]
– Specific heat [J/kg-K]
The ignition temperature is related to the critical external heat flux required for ignition to occur; this critical heat flux is:
![]() (6)
(6)
Also by manipulating Equations 3 and 5, the following relationship is obtained:
![]() (7)
(7)
After the start of pyrolysis, Equation 3 is modified as follows:
![]() (8)
(8)
![]() (9)
(9)
where Tv = Tign, and where the net heat flux is:
![]() (10)
(10)
with,
![]() - Flame heat flux [W/m2]
- Flame heat flux [W/m2]
Utilizing Cone Calorimeter Data with Theory
To determine the thermal properties of a given material, several cone calorimeter tests at different values of the radiant panel heat flux need to be conducted. Prior to testing, the mass density and thermal diffusivity of the material are assumed to be known. Mass density is simply obtained from a weight measurement. During testing the mass loss rate, time to ignition and radiant panel heat flux are recorded. Figure 1 shows a typical variation of the inverse of the square root of the ignition time with the radiant panel heat flux.
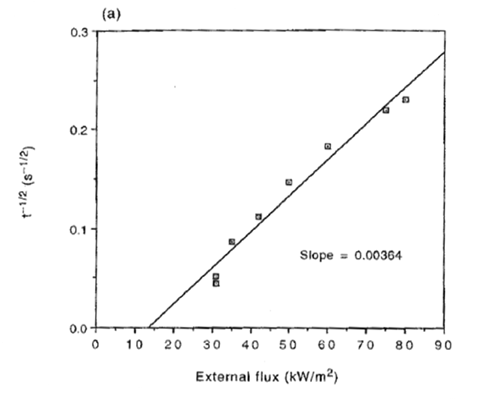
Figure 1 – Inverse of the Square Root of Ignition Time vs. Radiant Panel Heat Flux (2)
The point where the best fit straight line intercepts the x-axis provides an estimate of the critical heat flux, ![]() ,of the material. With this estimate of the critical heat flux, the ignition temperature, Tig, can be calculated using Equation 6. Finally using the ignition temperature and the slope of the linear fit in Figure 1, the thermal inertia, kρc, can be calculated using Equation 7.
,of the material. With this estimate of the critical heat flux, the ignition temperature, Tig, can be calculated using Equation 6. Finally using the ignition temperature and the slope of the linear fit in Figure 1, the thermal inertia, kρc, can be calculated using Equation 7.
After the thermal inertia has been determined the thermal conductivity (k) and specific heat (Cp) can be calculated using the predetermined values of mass density and thermal diffusivity.
Furthermore, Figure 2 shows a typical variation of the fuel mass loss rate with the radiant panel heat flux.
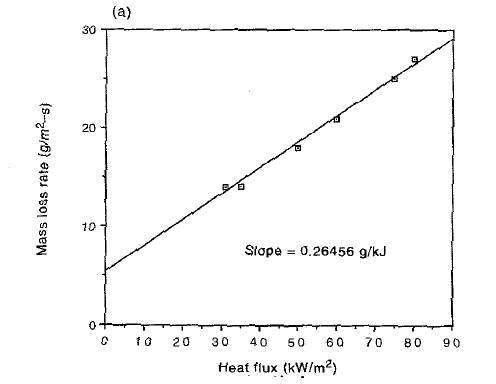
Figure 2 – Fuel Mass Loss Rate vs. Radiant Panel Heat Flux (2)
At steady state, the RHS of Equation 9 is zero and one may write:
![]() (11)
(11)
The inverse of the slope of the linear fit in Figure 2 gives an estimate of the heat of gasification.
References
1. Harper, Charles A. Handbook of Building Materials for Fire Protection. New York : McGraw-Hill , 2004. ISBN.
2. Hopkins Jr., D. and J.G. Quintiere. Material Fire Properties and Predictions for Thermoplastics. Fire Safety Journal. 1996, 26.
3. Spearpoint, MJ and Quintiere, JG. Predicting the Piloted Ignition of Wood in the Cone Calorimeter using an Integral Model - Effect of the Species, Grain Orientation and Heat Flux. Fire Safety Journal. June No.4, 2001, Vol. 36.
Properties at ~300 K |
Properties at Tig |
|||||||||||
| Material | Tig |
k |
ρ |
Cp |
(kρCp)To |
Lg |
k |
ρ |
Cp |
(kρCp)Tig |
Lg |
Reference |
[K] |
[W/m-K] |
[kg/m3] |
[kJ/kg-K] |
[kJ2-s-m-4-K-2] |
[MJ/kg] |
[W/m-K] |
[kg/m3] |
[kJ/kg-K] |
[kJ2-s-m-4-K-2] |
[MJ/kg] |
||
| METALS | ||||||||||||
| Aluminum | 205 |
13 |
||||||||||
| Aluminum, 6061 | 167 |
2700 |
0.896 |
404.006 |
8 |
|||||||
| Aluminum, 7075 | 130 |
2800 |
0.841 |
306.124 |
8 |
|||||||
| Aluminum, Duralumin (4% Cu 0.5% Mg) | 775 |
177 |
2770 |
0.875 |
429.004 |
6 |
||||||
| Aluminum, Duralumin (4% Cu 0.5% Mg) | 164 |
2787 |
0.883 |
403.591 |
8 |
|||||||
| Aluminum, Pure | 933 |
237 |
2702 |
0.903 |
578.258 |
6 |
||||||
| Aluminum, Pure | 237 |
2707 |
0.905 |
580.611 |
8 |
|||||||
| Stainless Steel, AISI 304 | 1670 |
14.9 |
7900 |
0.477 |
56.148 |
6 |
||||||
| Stainless Steel, AISI 304 | 13.8 |
8000 |
0.4 |
44.16 |
8 |
|||||||
| Stainless Steel, AISI 316 | 13.4 |
8238 |
0.468 |
51.662 |
6 |
|||||||
| Stainless Steel, AISI 316 | 13.5 |
8000 |
0.46 |
49.68 |
8 |
|||||||
| Stainless Steel, AISI 347 | 14.2 |
7978 |
0.48 |
54.378 |
6 |
|||||||
| Stainless Steel, AISI 347 | 15 |
8000 |
0.42 |
50.4 |
8 |
|||||||
| Stainless Steel, AISI 410 | 25 |
7700 |
0.46 |
88.55 |
8 |
|||||||
| Steel | 50.2 |
13 |
||||||||||
| Steel, 0.5% C | 54 |
7833 |
0.465 |
196.687 |
8 |
|||||||
| Steel, 1% C | 43 |
7801 |
0.473 |
158.665 |
8 |
|||||||
| Steel, 1.5% C | 36 |
7753 |
0.486 |
135.646 |
8 |
|||||||
| Steel, AISI 1010 | 63.9 |
7832 |
0.434 |
217.202 |
6 |
|||||||
| Steel, AISI 1010 | 64 |
7830 |
0.434 |
217.486 |
8 |
|||||||
| Steel, Plain | 60.5 |
7854 |
0.434 |
206.222 |
6 |
|||||||
| PLASTICS | ||||||||||||
| Nylon | 653 |
1169 |
2.4 |
0.33 |
1169 |
2.3 |
0.87 |
3.8 |
5 |
|||
| Polyester | 680 |
0.2 |
1345 |
1.15 |
0.59 |
1.3 |
4 |
|||||
| Polyethylene | 573 |
955 |
0.638 |
2.3 |
0.64 |
955 |
3 |
1.8 |
3.6 |
5 |
||
| Polyethylene | 1.9-2.3 |
1.9-2.3 |
11 |
|||||||||
| Polyethylene, Foam | 1.55 |
1.55 |
4 |
|||||||||
| Polyethylene, HD | 653 |
0.43 |
959 |
2 |
0.82 |
2.30 |
1.8 |
2.30 |
4 |
|||
| Polyethylene, LD | 650 |
0.38 |
925 |
1.55 |
0.54 |
1.80 |
1.2 |
1.80 |
4 |
|||
| Polyethylene, MD | 635 |
0.4 |
929 |
1.7 |
0.63 |
1.3 |
4 |
|||||
| Polymethylmethacrylate | 453 |
1190 |
0.339, 0.365 |
1.6 |
0.43 |
1190 |
4.1 |
2.1 |
2.8 |
5 |
||
| Polymethylmethacrylate | 578 |
2.12 |
9 |
|||||||||
| Polymethylmethacrylate | 1.4-1.6 |
11 |
||||||||||
| Polypropylene | 640 |
0.15 |
880 |
1.88 |
0.25 |
2.00 |
0.53 |
2.00 |
4 |
|||
| Polypropylene | 483 |
0.38 |
900 |
6.3 |
0.367 |
2 |
900 |
2.2 |
3.1 |
5 |
||
| Polypropylene | 578 |
2.15 |
7 |
|||||||||
| Polypropylene | 1.4-2 |
1.4-2 |
11 |
|||||||||
| Polystyrene | 693 |
1.17 |
3 |
|||||||||
| Polystyrene | 629 |
0.14 |
1045 |
1.25 |
0.18 |
1.60 |
0.39 |
1.60 |
4 |
|||
| Polystyrene | 0.033 |
1.7-2.2 |
1.7-2.2 |
11,13 |
||||||||
| Polystyrene Foam | 649 |
0.58 |
1.3-1.9 |
1.3-1.9 |
1,11 |
|||||||
| Polyurethane | 0.02 |
13 |
||||||||||
| Polyurethane, Flexible | 651 |
1.95 |
1.95 |
4 |
||||||||
| Polyurethane, Rigid | 651 |
0.19 |
1100 |
1.76 |
0.37 |
3.25 |
0.78 |
3.25 |
4 |
|||
| Polyvinylchloride | 688 |
1.31 |
2 |
|||||||||
| Polyvinylchloride | 3.1 |
3.1 |
11 |
|||||||||
| Rigid Polyurethane Foam | 643 |
0.04 |
1 |
|||||||||
| Rigid Polyurethane Foam | 1.2-5.6 |
1.2-5.6 |
11 |
|||||||||
| Rubber, Hard | 0.16 |
1190 |
6 |
|||||||||
| Rubber, Soft | 0.13 |
1100 |
2.01 |
0.287 |
6 |
|||||||
| SBR | 664 |
0.17 |
1100 |
1.88 |
0.35 |
2.30 |
0.78 |
2.30 |
4 |
|||
| Teflon | 0.35 |
2200 |
6 |
|||||||||
| WOODS | ||||||||||||
| ~HARDWOOD~ | ||||||||||||
| Ash | 0.15-1.3 |
740 |
8 |
|||||||||
| Balsa | 0.055 |
1740 |
6 |
|||||||||
| Balsa | 0.05 |
100 |
8 |
|||||||||
| Hardwood | 0.16 |
720 |
1.255 |
0.145 |
3.068 |
6,4 |
||||||
| Mahogany | 0.16 |
700 |
8 |
|||||||||
| Oak | 0.17 |
545 |
2.385 |
0.221 |
6 |
|||||||
| oak | 0.1-0.4 |
600 |
2.39 |
8 |
||||||||
| Oven Dry Oak | 574 |
0.45 |
12 |
|||||||||
| Red Oak | 5.1-9.5 |
5.1-9.5 |
10 |
|||||||||
| Victorian Ash | 2.57 |
14 |
||||||||||
| Blackbutt | 2.54 |
14 |
||||||||||
| ~SOFTWOOD~ | ||||||||||||
| Cypress | 0.097 |
465 |
6 |
|||||||||
| Douglas Fir | 4.6-8.4 |
4.6-8.4 |
10 |
|||||||||
| Douglas Fir, Plywood | 0.12 |
550 |
1.2 |
0.079 |
8 |
|||||||
| Fir | 0.11 |
415 |
2.72 |
0.124 |
6 |
|||||||
| Fir | 0.12 |
600 |
2.72 |
0.196 |
8 |
|||||||
| Oven Dry Douglas Fir | 623 |
0.16 |
7 |
|||||||||
| particle board | 0.14 |
800 |
1.3 |
0.146 |
8 |
|||||||
| pitch pine | 0.14 |
450 |
8 |
|||||||||
| Softwood | 0.12 |
510 |
1.38 |
0.084 |
1.8 |
2.555 |
6,4 |
|||||
| Spruce | 0.11 |
4410 |
8 |
|||||||||
| White Pine | 0.11 |
435 |
6 |
|||||||||
| Yellow Pine | 0.15 |
640 |
2.805 |
0.269 |
6 |
|||||||
| Western Red Cedar | 3.27 |
14 |
||||||||||
| Redwood | 3.14 |
14 |
||||||||||
| Radiata Pine | 3.22 |
14 |
||||||||||
| Douglas Fir | 2.64 |
14 |
||||||||||
| ~MISC. WOOD~ | ||||||||||||
| Gypsum / Plaster Board | 0.17 |
800 |
6 |
|||||||||
| Particleboard, HD | 0.17 |
1000 |
1.3 |
0.221 |
6 |
|||||||
| Particleboard, LD | 0.078 |
590 |
1.3 |
0.060 |
6 |
|||||||
| Plywood | 0.12 |
545 |
1.215 |
0.079 |
6 |
|||||||
| Wood | 0.12-0.04 |
13 |
||||||||||
| MISC. | ||||||||||||
| Acoustic Tile | 0.058 |
290 |
1.34 |
0.023 |
6 |
|||||||
| Cotton | 0.06 |
80 |
0.13 |
0.001 |
6 |
|||||||
| Fiberglass | 0.04 |
13 |
||||||||||
| Glass | 0.8 |
13 |
||||||||||
| Glass, Plate | 1.4 |
2225 |
0.835 |
2.601 |
6 |
|||||||
| Glass, Pyrex | 1.4 |
2500 |
0.75 |
2.625 |
6 |
|||||||
| Leather | 0.159 |
998 |
6 |
|||||||||
| Paper | 0.18 |
930 |
1.34 |
0.224 |
6 |
|||||||
| Paraffin | 0.24 |
900 |
2.89 |
0.624 |
6 |
|||||||
| Refrigerant, R134a | 80.3 |
1198 |
1.432 |
137.758 |
6 |
|||||||
| Refrigerant, R22 | 82.6 |
1183 |
1.265 |
123.610 |
6 |
|||||||
| Wool Felt | 0.04 |
13 |
||||||||||
| Tig - Ignition Temperature | |||||||||
| (kρCp)To - Thermal Inertia at Room Temperature, To. Use typical values of k, ρ, Cp. | |||||||||
| (kρCp)Tig - Thermal Inertia at Ignition Temperature, Tig. (See Refs. 4, 5 or 10 to determine method used.) | |||||||||
| Lg - Heat of Gasification. Measured thru experimentation. Lg is the reciprocal of the slope of the mass loss rate per unit surface area plotted versus external heat flux. |
| Reference | |
1 |
Cleary, T. and J. Quintiere. Flammability Characteristics of Foam Plastics. NISTIR 4664. Gaithersburg, MD: National Institute of Standards and Technology, 1991. |
2 |
Dillon, S. Analysis of ISO 9705 Room/Corner Test: Simulations, Correlations and Heat Flux Measurements. College Park, MD: University of Maryland, 1998. |
3 |
Dlugogorski, B., D. Pope, b. Moghtaderi, E. Kennedy and J. Lucas. Fire Properties of Australian Eucalyptus. Presented at Wood & Fire Safety - 4th International Scientific Conference, The High Tatras, Slovak Republic, 2000. |
4 |
Harper, Charles A. Handbook of Building Materials for Fire Protection. New York: McGraw-Hill, 2004. |
5 |
Hopkins Jr, D. and J.G. Quintiere. "Material Fire Properties and Predictions for Thermoplastics." Fire Safety Journal, 1996, Vol.16. pp. 197-206. |
6 |
Incropera, F., D.DeWitt, T. Bergman, and A. Lavine. Fundamentals of Heat and Mass Transfer, 6th Edition. John Wiley & Sons, 2007. |
7 |
Janssens, M. Thermophysical Properties of Wood and their Role in Enclosure Fire Growth. Ghent, Belgium: The University of Ghent, 1991. |
8 |
Lienhard IV, John H. and John H. Lienhard V. A Heat Transfer Textbook, 3rd Edition. Cambridge: Phlogiston Press, 2006. |
9 |
Quintiere, J. and M. Harkleroad. New Concepts for Measuring Flame Spread Properties. NBSIR 84-2943. Gaithersburg, MD: national bureau of Standards, 1984. |
10 |
Spearpoint, M. and J. Quintiere. "Predicting the Piloted Ignition of Wood in the Cone Calorimeter using an Integral model: Effect of Species, Grain orientation, and Heat Flux." Fire Safety Journal, 2001, Vol.36, pp. 391-415. |
11 |
Tewarson, A. "Generation of Heat and Chemical Compounds in Fire." SFPE Handbook of Fire Protection Engineering, 3rd Edition. P. DiNenno, Ed. Quincy, MA: NFPA, 2002, Section 3, Chapter 4, pp. 82-161. |
12 |
Tran, H. and R. White. "Burning Rate of Solid Wood measured in an oxygen consumption Calorimeter." Fire and Materials, 1992, Vol. 16, pp. 197-206. |
13 |
Young, Hugh D. University Physics, 7th Edition, Addison Wesley, 1992. |
14 |
Janssens, Marc. Cone Calorimeter Measurements of the Heat of Gasification of Wood. Interflam '93. London:Interscience Communications Limited, 1993. |